Five Million Robots Now Work in Factories Worldwide: IFR World Robotics 2026 Numbers Are In
Introduction
There is a particular kind of milestone that does not make headlines because it arrives as a statistic rather than a launch event. A cross on a whiteboard, a figure nudged past a round threshold, and a press release that gets read carefully by a few thousand purchasing managers and almost nobody else. That is what the International Federation of Robotics delivered on 24 September 2026, when it published the World Robotics 2026 report from Frankfurt.
The headline figure is clean: the global operational stock of industrial robots reached five million units in 2025, up 9% on the previous year, and roughly doubling the count recorded seven years earlier. Annual installations crossed 600,000 units for the first time, an 11% jump. It is the kind of number that reads like a rounding error until you stand next to a single robot arm and realise how much of the world's manufactured physical volume now passes through a machine that never blinks.
IFR president Jane Heffner called it plainly: "Industrial automation is progressing at high speed." But the more revealing story sits underneath the global total, in the wildly uneven geography of who is actually buying the machines. China now takes 59% of every robot installed on Earth. The United States has just jumped past Japan into second place. And Europe, home to the densest robot population in the world, is installing fewer units than it did a year ago.
For anyone tracking automation as an economic signal rather than a technology demo, this report is worth reading closely. Our coverage of robotics and drones has tracked the humanoid arms and delivery drones dominating the headlines; this is the denominator story that explains what those headline deployments are actually adding up to.
Five Million and the Doubling Curve
The headline claim needs a little discipline, because "five million robots" is frequently quoted in a way that conflates several different things. IFR's figures cover industrial robots specifically — the articulated arms, SCARA units, delta robots and Cartesian systems used in manufacturing and production lines. They do not include service robots, consumer devices, warehouse mobile robots, or the humanoids that generate most of the current media attention. The federation is explicit about this scope in its press materials, and it is the scope that makes the number meaningful: this is a count of machines permanently installed in production environments, not cumulative shipments or pilots.
The trajectory is what makes five million more than a nice round number. Heffner's framing was that the stock is "more than double the number seven years ago." Annual installations — the flow, as distinct from the stock — have climbed from roughly 540,000 in 2024 to over 600,000 in 2025. When a stock grows 9% annually it doubles in roughly eight years, so the curve is being sustained, not bumped.
The federation's own outlook projects installations rising 9% to 655,000 units in 2026, and reaching 806,000 units by 2029. Those are forecasts, not observations, and IFR says so. A 806,000 installation year would be roughly a third higher than 2025's figure — meaningful acceleration, but it depends on the same structural drivers holding: labour scarcity, reshoring, and continued improvements in machine vision and AI perception.
China Took 59% of a Record Year
China's 2025 number is the headline within the headline. The country installed 354,000 industrial robots during 2025, up 20% year-on-year, and beat its own previous annual record by almost 60,000 units. That 354,000 is 59% of all robots installed worldwide in the year — a share large enough to distort the global average on its own.
More structurally significant than the volume is the supplier breakdown. Chinese robot manufacturers outsold foreign suppliers on their home turf for the first time in this series, taking 195,000 units and a 55% domestic market share, up from 57% in 2024. A market that had been closing slowly is now closing from the inside, with domestic suppliers winning in a home market that is also the largest single buyer in the world. That combination — enormous demand plus a maturing domestic supply base — is the configuration most likely to produce genuine cost deflation in industrial arms over the next few years.
The rest of Asia was mixed. Japan installed 36,219 units, down 19%, and slipped from second to third place globally behind the United States. IFR expects only slight growth and no major near-term recovery. The Republic of Korea held fourth place at 30,000 units, down 1%, with a flat trend around 31,000 since 2019; IFR expects new automotive investment to land in 2027 and 2028 and potentially break that trend.
The genuine outlier is India, which installed almost 10,500 units in 2025, up 15%, enough for sixth place globally behind Germany. But the raw volume understates it: between 2020 and 2025 India's annual installations grew at a 27% compound annual rate. That is the fastest sustained expansion of any market in the report, and it is the number to watch. India is not yet a major robot consumer, but at 27% CAGR off a small base it becomes one within the forecast window.
The United States Overtakes Japan
The single most newsworthy ranking change in the report is the one that is not usually called a change at all. The United States installed almost 38,500 industrial robots in 2025, up 12%, overtaking Japan's 36,200 and becoming the second-largest market in the world after China. In IFR's own phrasing, 2025 was the third strongest year on record in the United States, behind 2018 and 2022.
What makes the US number interesting is its composition. Automotive remains the largest single customer sector at 13,500 units, but it fell 1% year-on-year — the growth came from elsewhere. Food and beverage installations rose 30% to 2,900 units. Warehousing, logistics and medical sectors contributed meaningfully, as Heffner put it. Meanwhile metal and machinery, the second-place sector, fell 15% to 3,000 units.
So this is not a reshoring boom story in the way that framing is usually deployed. Automotive is flat, traditional heavy machinery is contracting, and the growth is coming from food processing and logistics — categories that historically had the least automation and now have the most tractable repetitive work. The IFR's dedicated US release notes that most robots sold in the US are still imported from Japan and Europe, despite the growth of domestic integrators and a handful of emerging American robot manufacturers.
That import dependence is the strategic detail worth flagging. The second-largest robot market in the world still fills most of its cells with hardware designed, engineered and built elsewhere.
Europe's Slow Year in the Densest Region
Europe has the opposite problem, and it is worth separating "slow" from "declining" carefully, because the two get conflated constantly.
Germany is the largest European market and the fifth largest in the world, holding 41% of all EU installations. Its sales fell 8% in 2025 to fewer than 25,000 units — a real decline, and IFR notes that automotive's share of German robot demand is in retreat even though automotive remains the largest user. The longer-run framing is less grim: 2020 to 2025 installations across German industries grew at a 2% compound annual rate.
Italy, the second largest European market, fell 11% to about 7,800 units. France returned to third place in Europe with almost 4,500 units, down 8%. Spain fell 15% to about 4,300.
Yet density — robots per 10,000 manufacturing employees — tells the opposite story, and the contrast is instructive. IFR's robot density analysis put Western Europe at a record 267 robots per 10,000 employees, ahead of North America's 204 and Asia's 131. South Korea leads the world at 1,220 per 10,000, followed by Singapore at 818, Germany at 449, and Japan at 446.
Europe, in other words, has the highest concentration of robots per worker and is installing fewer new ones each year. That is not a contradiction — it is what a mature installed base looks like. Saturation reduces the annual installation rate while leaving density at a record. It also means European manufacturers are competing on the installed base rather than on new deployment volume, which is a different competitive problem with a different set of solutions.
Why the Curve Keeps Bending
IFR's explanation for continued growth rests on four factors, and they are worth taking in order of durability.
The first is supply-chain resilience. Recent trade and industrial policy developments in several major economies are driving relocation activity in manufacturing. Building capacity in high-wage economies and in countries facing labour shortages creates demand for automation almost by definition, because the alternative to a robot in a place with no available workers is not a cheaper worker — it is no worker.
The second is demography, and it is the most durable of the four. Ageing workforces in China, Japan, Korea and Germany are not a cyclical problem. These are thirty-year demographic commitments, and they do not reverse with a rate cycle.
The third is capability expansion driven by AI, machine vision and sensing. IFR's framing is that advances in these areas are increasing what robots can do, which is the mechanism by which the addressable market grows rather than just the penetration of an existing one.
The fourth is deployment cost, and it is the one most often overlooked. Easier programming and system integration are reducing the cost of getting a robot into a cell. Historically the robot arm was cheap relative to the integrator's time. When integration gets cheaper, the payback calculation improves for smaller operations that were previously too small to justify a cell — which is precisely how a 27% CAGR appears out of nowhere in India.
Two caveats belong alongside any growth narrative. The 2026 and 2029 figures are projections, and IFR itself flags that regional patterns may shift as relocation reshapes where robots get installed even if the global total keeps rising. And the 2025 stock count is a snapshot of machines in place, not of machines performing useful work at any given moment. Utilisation rates, retrofit cycles and cell redeployment all sit between the installation statistic and actual factory output, and none of them are in this dataset.
Conclusion
The five million figure is the wrong headline for what is actually happening, which is why it can be misread in both directions. It is not evidence that factory automation has arrived everywhere, and it is not evidence that the humanoid era is imminent. It is a count of installed industrial capacity, growing 9% a year, concentrated in one country that takes 59% of the global market, in a region mix that is shifting under trade pressure, and in industries — food, logistics, medical — that were not automation candidates a decade ago.
The durable read from the World Robotics 2026 report is that industrial robotics has become infrastructure rather than innovation. Like electricity or container shipping, it stops being news when it works, and the interesting questions move to where it is being built, who supplies it, and what happens when the growth rate in a mature region depends on outrunning saturation. Europe's declining installations against record density is the clearest example of that shift in this year's data.
The next checkpoint is 2027, when the Korean automotive investment cycle IFR flagged is expected to land and will either break a five-year flat trend or confirm it. And India's 27% CAGR, still off a base small enough to stay off most analysts' radar, is the number most likely to be quoted as the story of the next World Robotics edition.
Images

Articulated industrial robot arms operating in a metalworking or automotive manufacturing cell. Illustrative of the automation capacity counted in the IFR's industrial robot statistics.
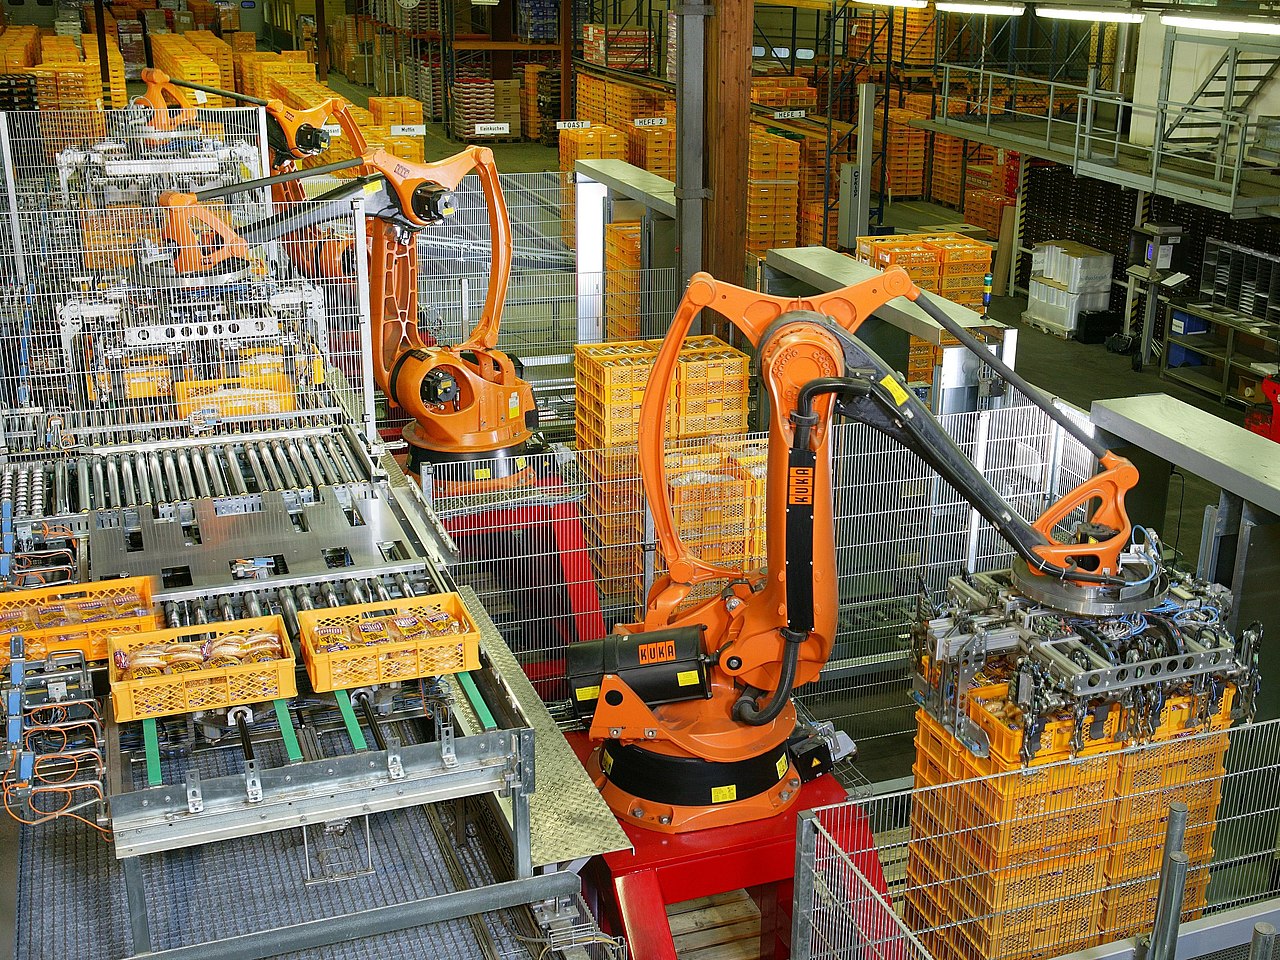
Automated case-handling and palletizing installation in a distribution centre, one of the logistics categories contributing to the growth in non-automotive robot demand.

A large articulated industrial robot within a guarded factory cell. The equipment is consistent with automated metal processing; the specific manufacturing process cannot be determined from the image alone.
References
- International Federation of Robotics, "Five Million Robots now Operate in Factories Globally," World Robotics 2026 Report, Frankfurt, 24 September 2026 — https://ifr.org/ifr-press-releases/news/five-million-robots-now-operate-in-factories-globally
- International Federation of Robotics, "U.S. now Second-Largest Robotics Market, Following China," 24 September 2026 — https://ifr.org/downloads/press_docs/EN-2026-SEP-24-IFR_Press_Release_WR-USA.pdf
- International Federation of Robotics, "Robot Density Surges in Europe, Asia, and Americas," 8 April 2026 — https://ifr.org/ifr-press-releases/news/robot-density-surges-in-europe-asia-and-americas
- RoboticTomorrow, "Five Million Robots Now Operate in Factories Globally," 24 September 2026 — https://www.roboticstomorrow.com/news/2026/09/24/five-million-robots-now-operate-in-factories-globally/27154
- Image credits: Wikimedia Commons — FANUC 6-axis welding robots (CC BY-SA), Factory Automation Robotics Palettizing (CC BY-SA), Giga-press robot crop (CC BY-SA)